https://bible-family-tree.pages.dev/

This is a react web app that displays an interactive, comprehensive family tree of the Bible. It’s available at https://bible-family-tree.pages.dev/ (deployed on cloudflare).
It was made with data from
Robert Rouse
.
Check out my
source code on GitHub
Once as I read through the bible, as I’m sure many people have, I created a family tree like this:
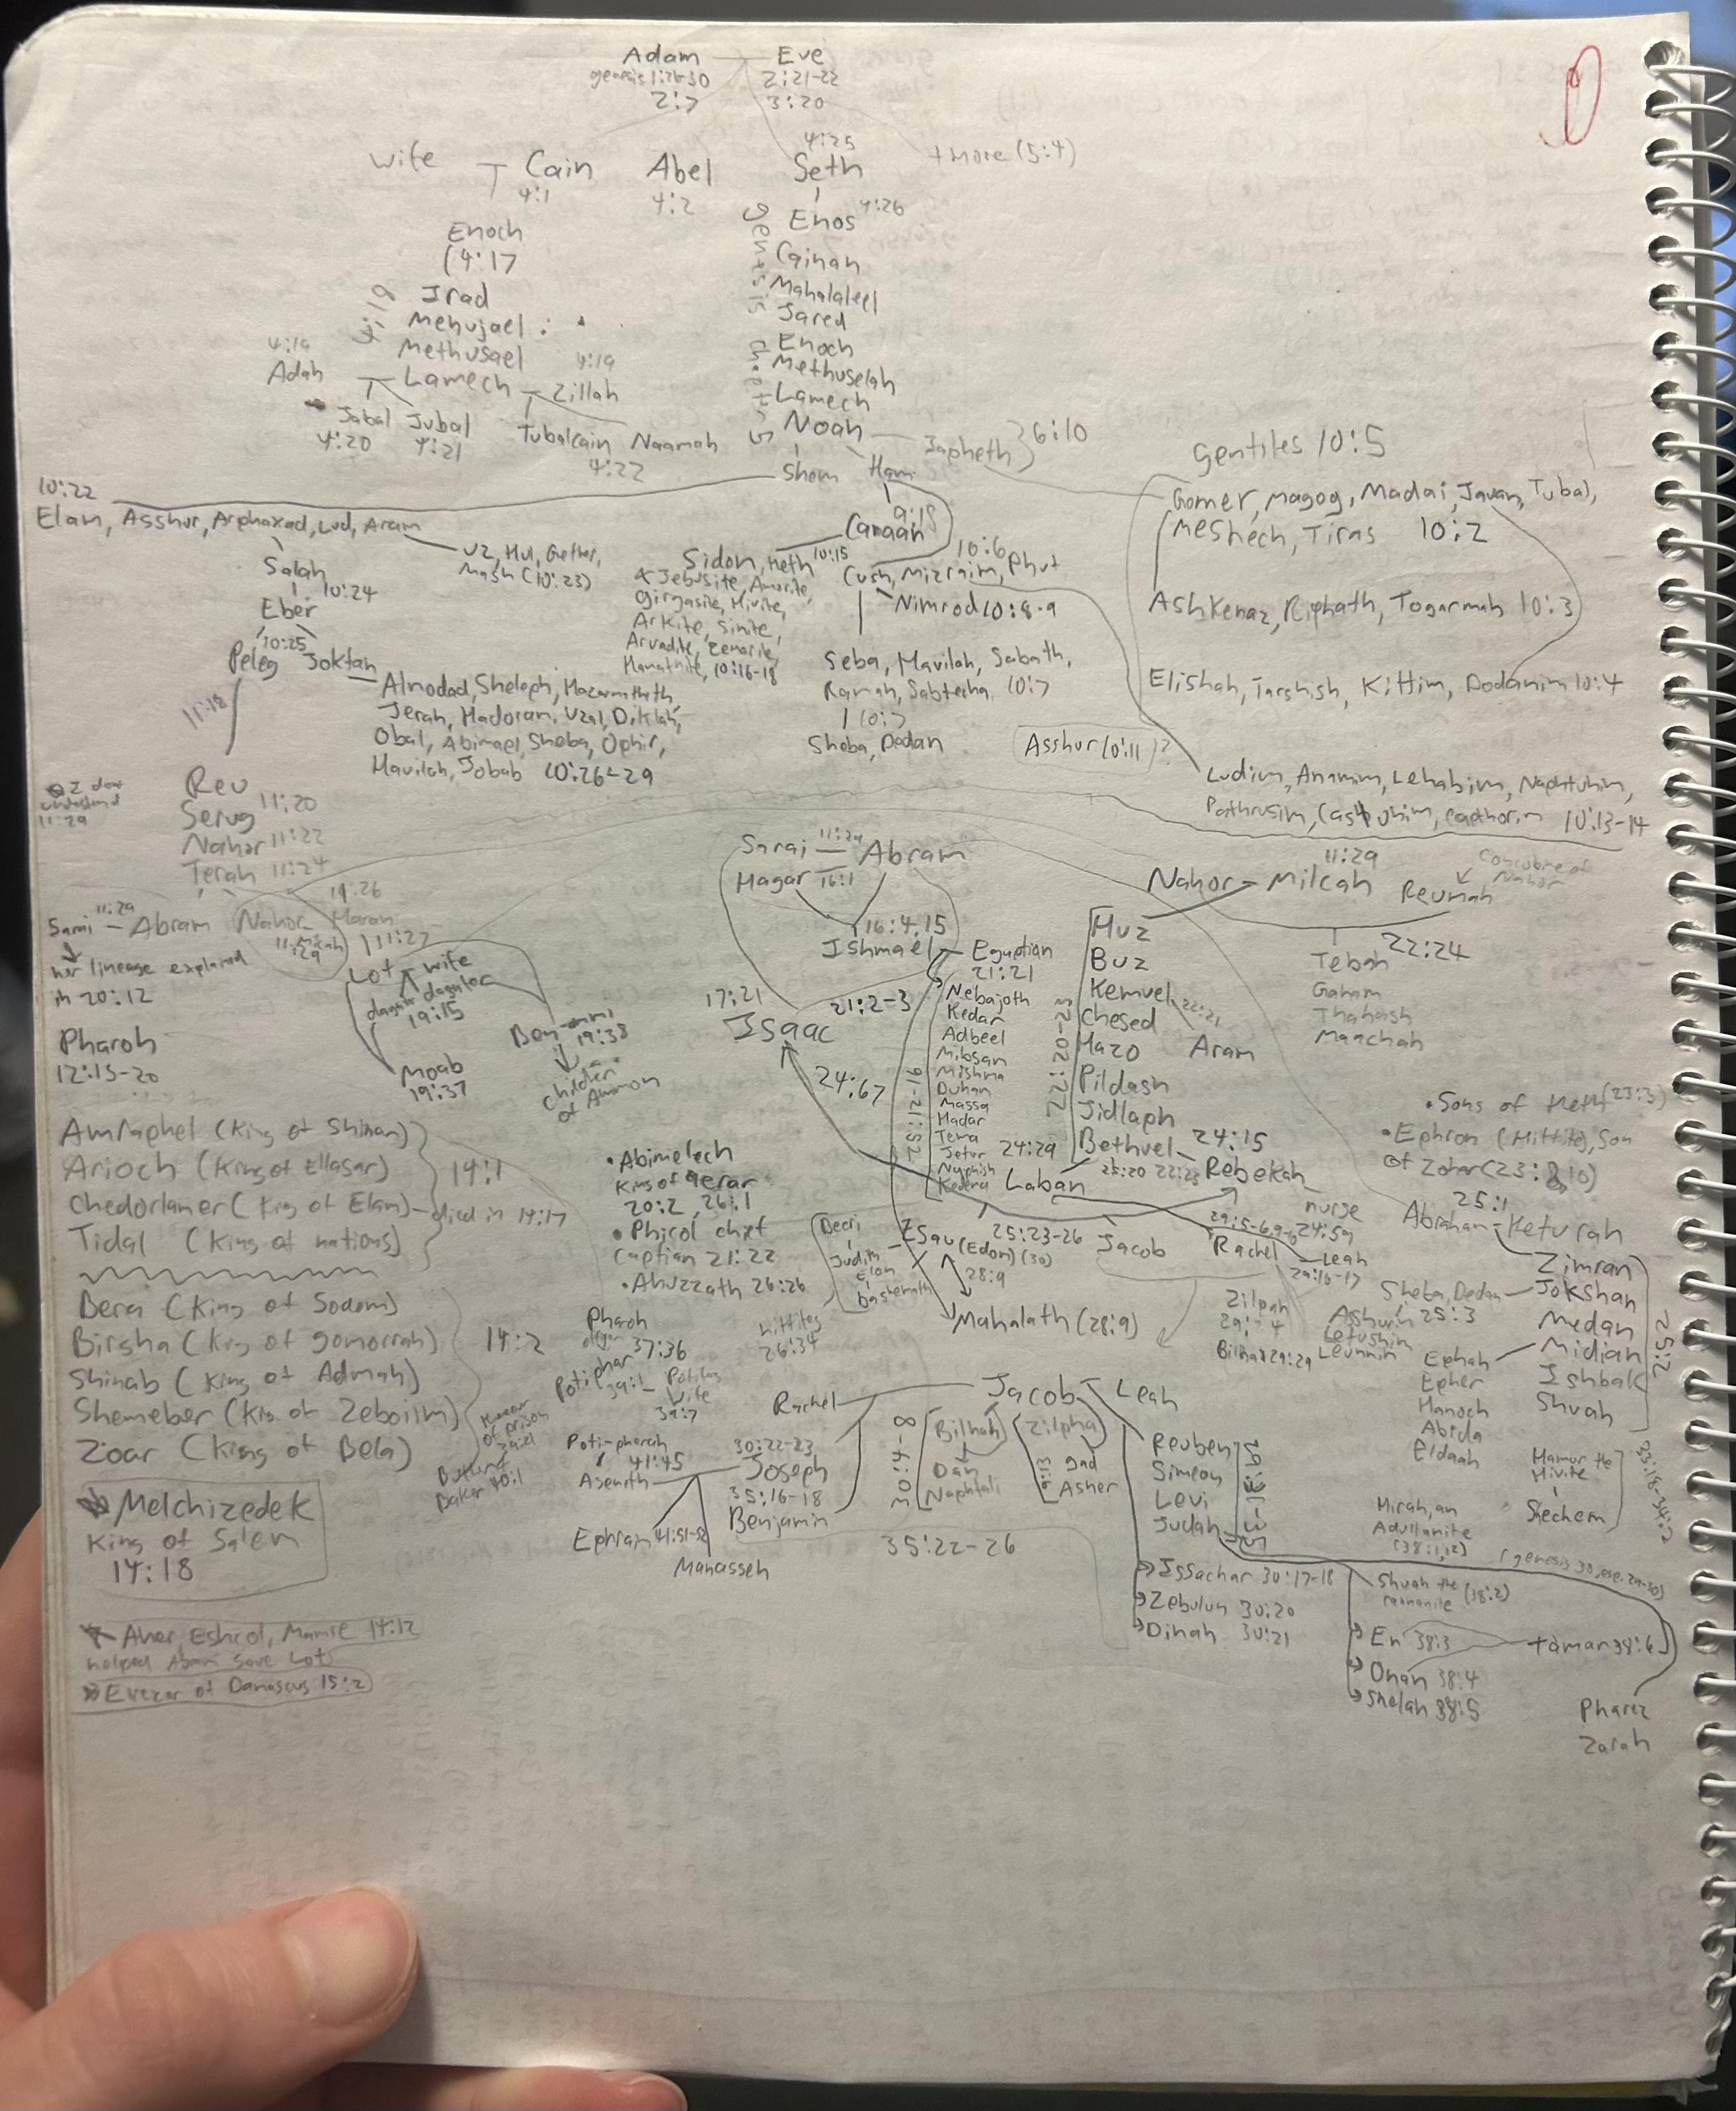 And I knew that there was a better way to explore and analyze the genealogy of Adam and Eve as described in the Bible.
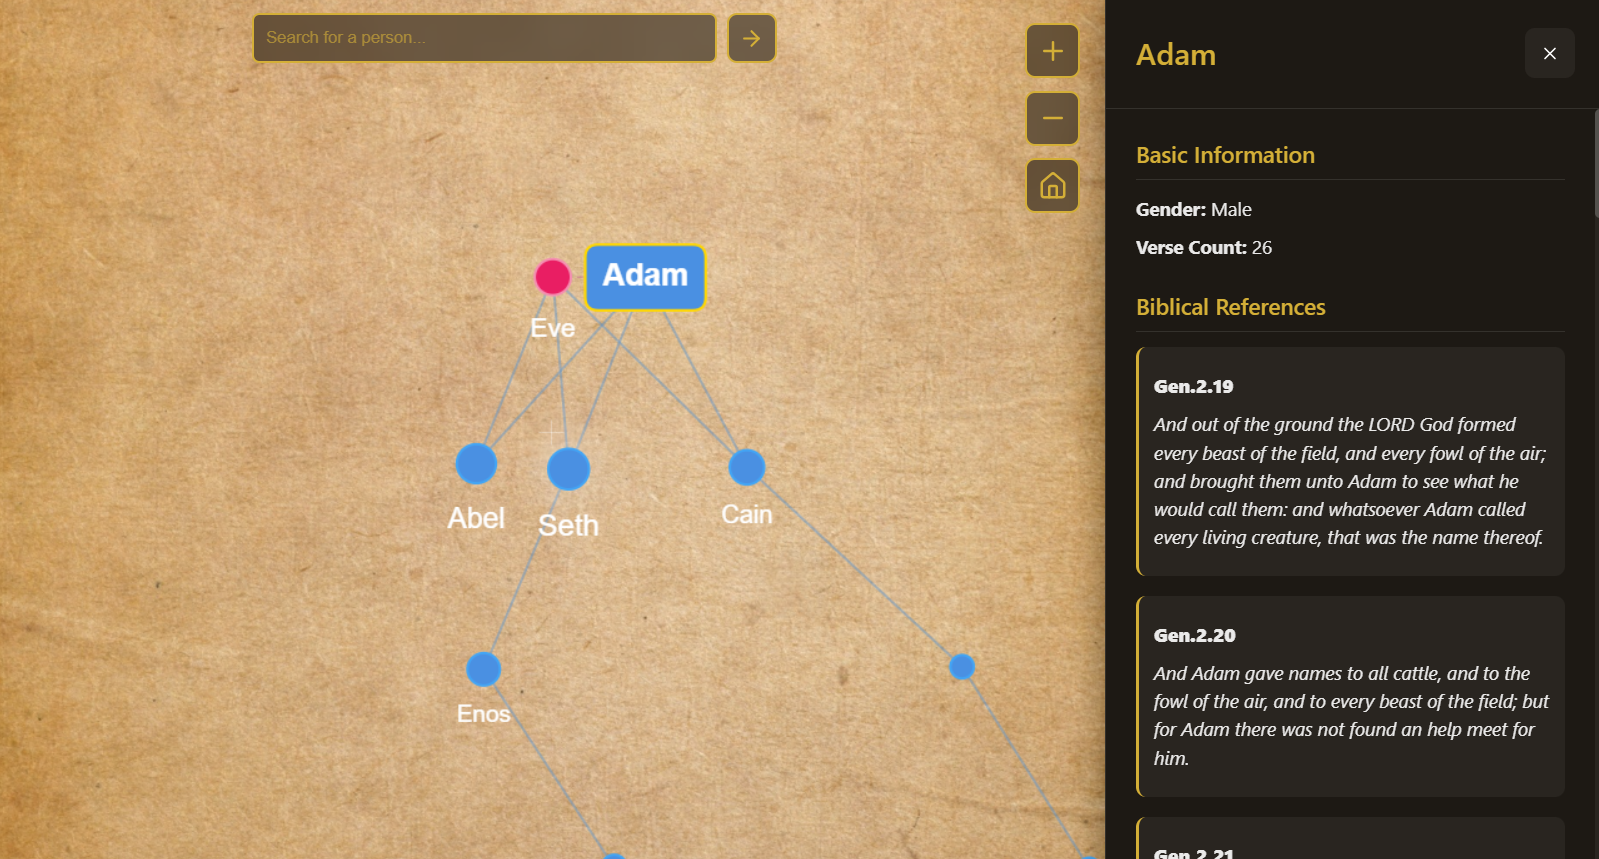
What I came up with was essentially a graph viewer. Users can drag and pan around and see the graph of family relationships from Adam to Jesus.
And I knew that there was a better way to explore and analyze the genealogy of Adam and Eve as described in the Bible.
What I came up with was essentially a graph viewer. Users can drag and pan around and see the graph of family relationships from Adam to Jesus.
It features:
- Canvas-based rendering - Fast, smooth rendering using HTML5 Canvas
- Physics-based layout - Uses d3-force for natural node positioning
- Proximity-based scaling - Nodes grow larger as they approach the center. Also, names appear for only the nodes nearest the center.
- Free-pan interaction - Drag to move the camera/focus
- Zoom controls - Scroll to zoom in/out
Technical Stack:
- React 18 - UI framework
- Vite - Build tool and dev server
- d3-force - Physics simulation for node layout
- Canvas API - High-performance rendering
I have two data files:
- public/genealogyData.json which contains the minimum information to build the tree, and
- public/peopleData.json which has more indepth information on each person, which is used in the profile panel.
About the data:
The data is from https://github.com/robertrouse/theographic-bible-metadata . Thanks to Robert Rouse from viz.bible . The data was taken in December 2025, so any updates to this github database since then may not be reflected on this family tree. I’ve transformed some of the data from this dataset to match my goals of this project:
- Before, people had IDs that started with ‘rec’…. like ‘recxG5Gs5geHBVxh4’. I’ve switched their ID’s to be the fields.personLookUp (like “peter_2745”), in order to be more readable.
- I’ve removed some entries like God, Satan, Holy Spirit (mortals only should be on this family tree). I remove Zoar (recDxMY9yZjgCvyeC). This is not a person but a place and should not be in the dataset. I’ve opened an issue for this on Robert’s github. I remove Cush (recIauM7ngrOI4BwH) because has no verses nor relatives and therefore cannot be placed on a family tree.
- I needed a way to disambiguate between people with multiple names, like Noah who built the Ark and Noah the daughter of Zelophehad (Numbers 27:1-11), so I added a field called “ShortDesc” to each person. This is shown when you search people in the search bar.
Caveats to this data:
Unconnected components: There are many unconncted components in this graph (people in the dataset - those mentioned in the bible, that do not have a direct connection to the lineage of Adam and Eve.) For example, it’s documented in the dataset that Simon Peter (peter_2745) had a father (<jonas_1687>) and a brother (<andrew_264>), but because these have no other connections to anyone else, they are not displayed in the dataset. A full list of unconected components is available on Github.
No relationship for descendants
John the baptist (john_1676) is not displayed in this dataset because he is part of an unconnected component (him and his mother elisabeth_1152 and father zacharias_2971). However, he could be placed in the family tree because we know from Luke 1:5
“There was in the days of Herod, the king of Judaea, a certain priest named Zacharias, of the course of Abijah; and his wife was of the daughters of Aaron, and her name was Elisabeth.”
So there could be a new type of relationship connection “descendantOf” that connects Elisabeth to Aaron, and Zacharias to Abijah. This type of connection is not documented in the dataset I used for this project, but I wish it were. It would basically be like a parent/child relationship but would ignore generations.
Sibling relationships It wasn’t until after I had finished this project that I realized it was possible for someone to have siblings but no father/mother/spouse/children. For example, person A could be listed simply as a brother to person B, and person B’s mother could connect back to Adam and Eve, but just because A and B are “brothers,” doesnt mean they necesarrily share the same parent that connects to Adam and Eve. In the original dataset, we’re given a list of siblings and half siblings, so we have the data to fix this, I just didn’t think about this till later. If someone has the time and interest to go back and fix my mistake, it would be well accepted. It would require creating a new type of connection “sibling” in the graph. However, I’m not even sure that anyone is left out of the family tree that should be here because of this error. A full list of people with only sibling relationships and not parental/spouse/children relationships is available on GitHub.
Other Notes about this code:
- I originally added a field called “nearestTo” to each of the people in the database that didn’t have a parent/child/spouse. At the time, my idea was for ALL people mentioned in the bible to be in this family tree, and I would place those that only have a nearestTo field near the person they’re nearest to. There would be an invisible connection between the two people. This was nice because it let me place people like Paul, Pharaoh, Pontius Pilate who all do not have any family mentioned in the bible on the tree near where they might’ve been (Pontius near Jesus, Pharoah near Moses), however, everyone having a nearestTo made it so the tree was too crowded and hard to read. I’ve removed most of the logic for showing nearestTo connections, but the nearestTo field still remains in my dataset for many orphans.
- Fearing too much data displayed and loaded at once would drain user’s devices resources, I originally had a slider for the ability to change degrees of seperation. The degrees of seperation being how many degrees away from the focused person could you see. If your focused person was Adam, and your degrees of seperation was 3, you could see down to Cainan, if it was two you could see down to Enos (on Seth’s line). However, I later changed my mind and decided that it was too confusing for people, and this didn’t drain too hard on most devices, so removed the slider completely and now always show all people all generations down.
- I load the graph data in in a strange BFS way, not just all at once. I use d3 to generate the graph and found that when I generate the whole graph all at once, it’s very flat and wide, and is very hard to read. However, when I render one generation at a time in a BFS, the tree is much taller and skinnier and makes more sense to viewers.